Pre-seed founders do not need a dashboard full of metrics. Learn the four SaaS numbers to track, how to label them, and when a tool is worth buying.
Founders can spend hours building dashboards while still struggling to answer four basic questions:
What is a customer worth? How long does a sale take? Where do prospects convert? What does acquiring one customer actually cost?
That is why the best SaaS metrics tools for pre-seed founders may be a spreadsheet rather than a paid metrics platform.
The Four Numbers to Track First
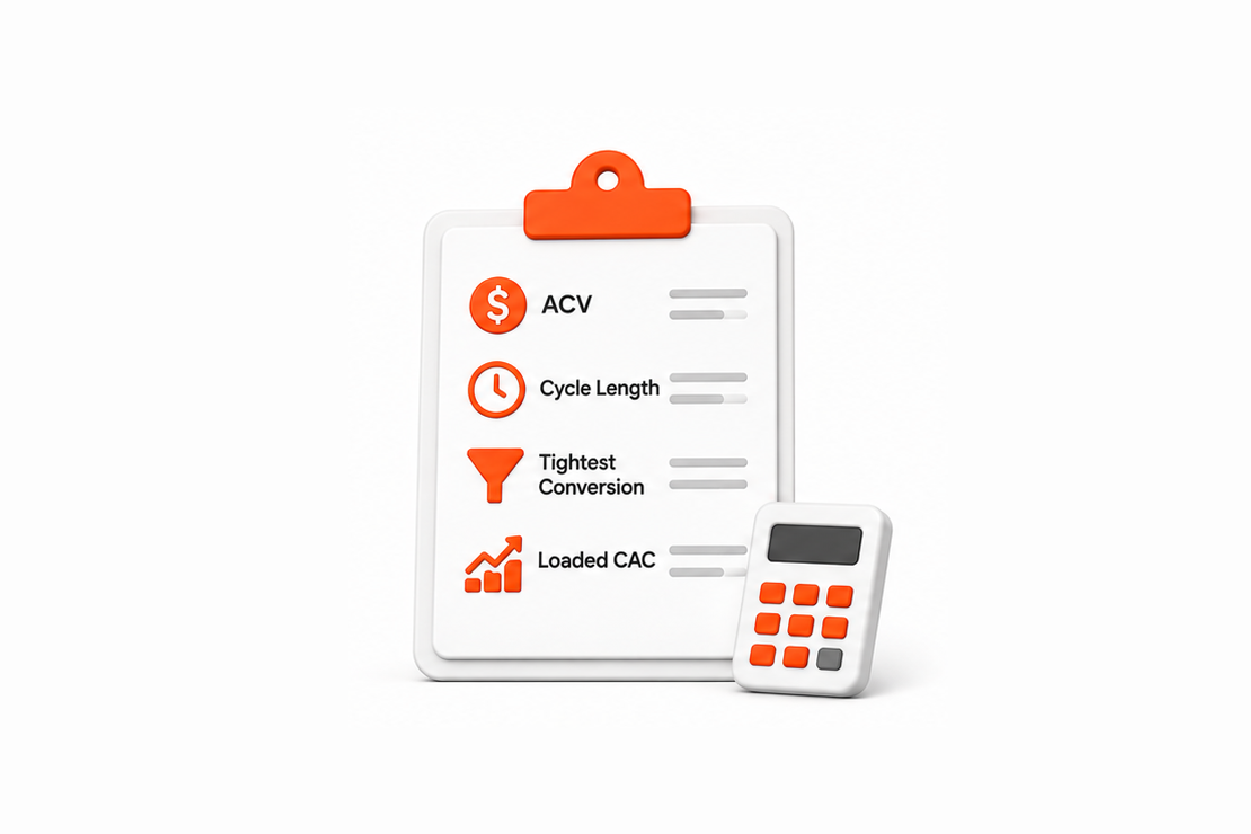
At pre-seed, start with:
- ACV: What one customer is worth over a year
- Sales cycle: Time from meaningful first contact to payment
- Conversion: One stage where you have enough evidence to trust the rate
- Fully loaded CAC: Acquisition cost including founder time
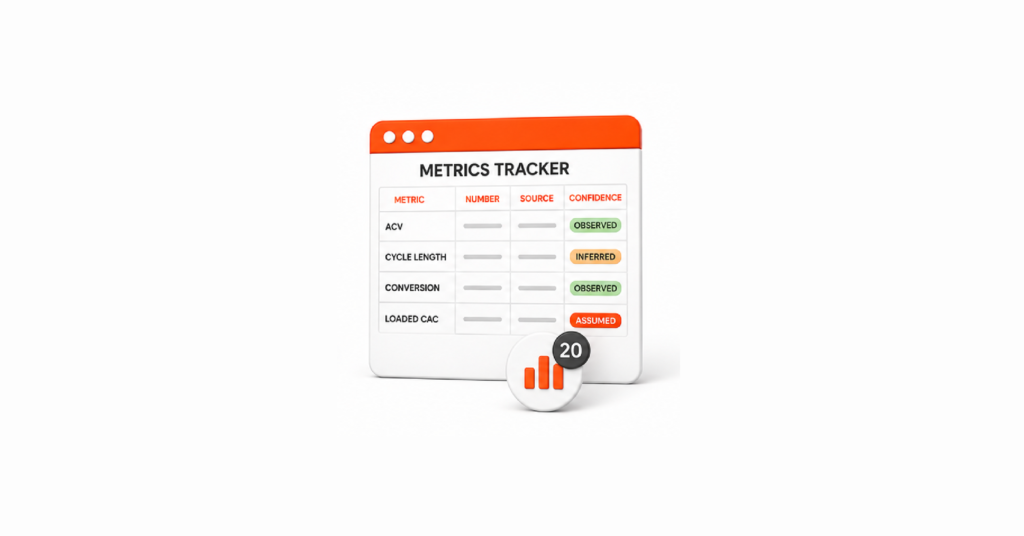
Tinova’s current GTM framework for investors uses these four numbers and labels them Observed, Inferred, or Assumed. That keeps a small dataset from looking more certain than it is.
Label the Number, Not Just the Metric
Use three confidence levels:
| Confidence | Meaning |
| Observed | Measured from your own customer data |
| Inferred | Calculated from partial evidence |
| Assumed | Based on an estimate or external benchmark |
For example:
ACV: $8,000 | Observed
CAC: $2,100 | Inferred
Target CAC: $1,500 | Assumed
A smaller number with a clear label is more useful than a polished dashboard that hides where the number came from.

CAC Gets Misleading When Founder Time Is Free
A founder might spend 40 hours closing a $5,000 customer and report CAC using only software and advertising costs.
That misses part of the acquisition effort.
Stripe’s guide explains CAC as total sales and marketing costs divided by new customers acquired, and notes that SaaS teams can segment CAC by channel, customer type, or sales motion. Stripe’s SaaS CAC guide is a useful reference for the calculation and its limits.
At pre-seed, track two versions:
Spend CAC: Direct acquisition costs.
Fully Loaded CAC: Direct costs plus the economic value of founder sales time.
Your time has a cost even when no salary appears in the spreadsheet.
For a deeper pre-seed example, see Tinova’s Pre-Seed CAC guide, which shows how to model CAC before you have enough customers for a historical figure.
The Pre-Seed Metrics Stack
| Tool | What it does | Best use at pre-seed |
| Spreadsheet | Tracks core metrics | Start here |
| Product analytics free tier | Tracks product events | Use for a specific product question |
| ChartMogul / Baremetrics | Revenue and cohort analysis | Add when recurring data is substantial |
| BI software | Connects multiple data sources | Add when reporting gets harder to manage |
| AI finance tools | Automates analysis | Add when finance work needs it |
Name the decision before you buy the software.
A tool should answer a business question, not give you more charts to review.
Why SaaS Benchmarks Need Context
A benchmark is not useful just because it comes from a large report.
Ask:
Who was measured? When? At what stage? With what sales motion?
Benchmarkit provides a useful example because its 2026 SaaS benchmark report lets readers filter results by company profile, including factors such as company size, ACV, customer type, product category, and go-to-market motion. Benchmarkit’s 2026 SaaS & AI-Native Metrics gives the broader dataset.
A $2,000 ACV self-serve business should not be judged against a $100,000 enterprise sales motion.
Your own data should lead. Benchmarks should provide context.
Build Your Own Benchmark
Track every closed deal by:
- ACV
- Acquisition source
- Sales cycle
- Conversion stage
- CAC
- Customer type
You do not need a huge customer base to start learning.
Tinova’s investor GTM framework makes the same distinction: a small set of deals can provide an early signal, but it should still be labeled according to how much evidence supports it.
Your own dataset will eventually tell you more about your sales motion than a generic SaaS average.
When Should You Buy a Metrics Tool?
Do not use a fixed customer count as the trigger.
A paid tool earns its place when:
Your spreadsheet takes too much time.
Reporting has become a recurring operating task.
Your data lives across several systems.
You need billing, CRM, product, and customer data connected.
You have a question your current setup cannot answer.
For example, which segment has the strongest retention or which channel produces the best payback.
Someone besides the founder needs to run reporting.
Your system now needs a repeatable process.
The upgrade trigger is a real reporting problem, not a number copied from another startup.
Do Not Confuse Signups With Evidence
A large signup count can look impressive while telling you little about customer quality.
Tinova’s 1,000 Signups Is Not Traction makes this distinction clearly: activation, repeat usage, payment, and referrals provide stronger evidence than a large signup total.
For metrics reporting, the same rule applies:
A bigger number is not automatically a better signal.
The Benchmark Trust Test
Give one point for each statement that is true:
| # | Check | Score |
| 1 | The original source is named | 1 |
| 2 | The dataset has a date | 1 |
| 3 | Sample size is available | 1 |
| 4 | Stage is clear | 1 |
| 5 | Sales motion is clear | 1 |
| 6 | Customer type is clear | 1 |
| 7 | Calculation method is explained | 1 |
| 8 | The benchmark resembles your business | 1 |
| 9 | You can trace the number to the publisher | 1 |
| 10 | Your own data supports or challenges it | 1 |
0 to 3: Do not cite it as evidence.
4 to 6: Use it for planning.
7 to 8: Cite it with context.
9 to 10: Compare it directly with your own data.
One Practical Lesson From Tinova’s Own Data
Tinova’s current results library reports 200 startups diagnosed, 77+ businesses scaled, 3 awards in 2026, and $10M+ in client pipeline built. The site separates client-specific results from broader agency figures and states that individual client outcomes are not guarantees. See Tinova’s results library.
That same discipline belongs in a pre-seed metrics sheet:
Say what the number measures, where it came from, and what it does not prove.
FAQ
What are the best SaaS metrics tools for pre-seed founders?
For most pre-seed founders, a spreadsheet is enough for ACV, sales cycle, conversion, and fully loaded CAC. Add product analytics or revenue software when you have a specific question the current setup cannot answer.
What SaaS metrics should a pre-seed founder track?
Start with ACV, sales cycle, one defensible conversion rate, and fully loaded CAC. Label each figure as Observed, Inferred, or Assumed.
How should I calculate CAC at pre-seed?
Use direct sales and marketing costs divided by new customers, then track founder time separately or include it in a fully loaded CAC view. The important part is making the calculation clear and consistent.
Are SaaS benchmark reports reliable?
They can be useful when the source, date, sample, stage, customer type, and sales motion are clear. Benchmarkit is one current example of a benchmark source that allows company-profile filtering.
When should a startup buy metrics software?
Buy when manual reporting creates a recurring burden, several data sources need to connect, or your current setup cannot answer an important operating question.
Ready to Rebuild Your Four Numbers?
You do not need a bigger dashboard to make your metrics stronger.
You need four numbers you can defend.
Start with ACV, sales cycle, conversion, and fully loaded CAC. Label the evidence behind each one. Then let your own data tell you when a software upgrade is worth paying for.
Tinova’s free GAP Analysis can help identify which business gap deserves attention first before you add another tool to the stack. The diagnosis is free and the build is scoped around what the numbers show.
Written by: Tinova Growth Team
Tinova is a marketing and growth agency for startups and owner-led businesses. Its official site reports 200 startups diagnosed, 77+ businesses scaled, 3 awards in 2026, and $10M+ in client funding pipeline built.
Updated: September 24, 2026
Review Focus: Repeatable revenue, retention, customer acquisition cost, business durability, product-market fit.