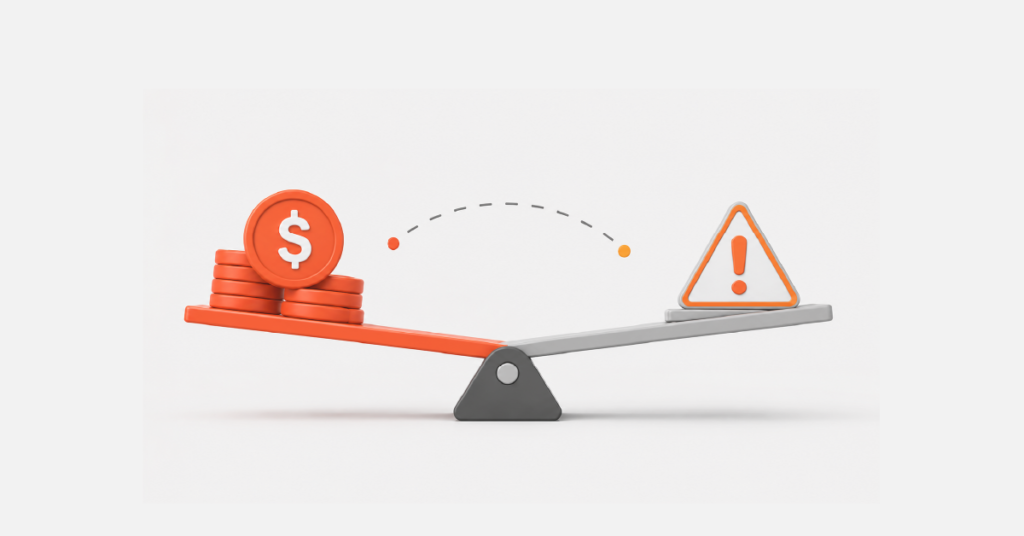
Early revenue can hide bigger risks. Learn how to test repeatable revenue, measure retention, compare CAC, and assess business durability before fundraising.
Your first customer pays. Then another. Revenue turns positive, and it feels like the business is working.
But early revenue can come from sales you cannot repeat. The customers may have come through referrals, warm introductions, one event, or a founder’s personal network.
The real question is not “Are we making money?”
It is:
“Can we create this revenue again with a similar process?”
Why Revenue Feels Safe but Can Hide Risk
Revenue is real proof that someone paid. It is not proof that the entire sales system works.
Ask yourself:
- Will customers renew?
- Can you find the next 100 customers without doubling costs?
- What happens if your biggest customer leaves?
- Can a new founder or salesperson repeat the same sales process?
One founder in Tinova’s source example had rapid growth, but acquisition costs were too high. When paid acquisition stopped, the growth stopped too.
Revenue looked healthy. The acquisition model was not.
That is why early sales need more context than a monthly revenue number.
The Repeatability Test: One-Off Wins or a Real Business?
Suppose you generated 30 leads and closed six customers.
That sounds good.
Now ask:
Could you repeat six sales from the next 30 similar leads using the same process?
If the six customers came from one introduction, one conference, or one unusual opportunity, you have sales. You may not have a repeatable revenue engine yet.
Customer type matters too. If every customer has a different problem, sales process, pricing model, and buying journey, the pattern is harder to repeat.
The 10-Customer Test
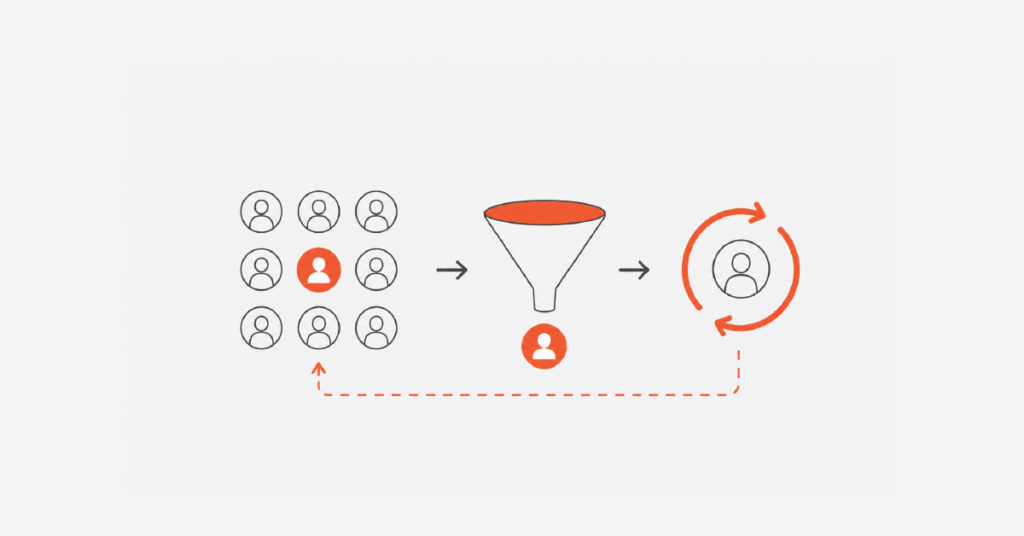
Review your last 10 paying customers.
Record:
How they found you
Why they bought
What they bought
How long the sales process took
Whether the buying journey looked similar
Then look for a pattern.
If most customers came through a similar source, had a similar problem, and followed a similar buying path, you have an early repeatability signal.
If every sale happened differently, the revenue may depend too heavily on founder effort or luck.
New Customer CAC vs. Returning Customer Economics
Customer acquisition cost (CAC) tells you what it costs to win customers. For subscription and recurring-revenue businesses, it is also useful to separate the cost of acquiring a new customer from the cost of keeping and expanding an existing one.
New customer CAC can include marketing, sales, software, commissions, and discounts needed for the first purchase.
Returning customer costs are different. Renewals and expansions may require less selling because the relationship already exists.
That comparison can reveal whether growth depends on constantly finding new buyers.
For subscription businesses, MRR measures predictable recurring income and can help you track whether recurring revenue is growing. Stripe’s MRR guide explains how the metric is calculated and used.
What the Revenue Mix Can Tell You
| Revenue Pattern | What It May Signal |
| 80%+ from new customers | Growth depends heavily on constant acquisition |
| 40% to 60% from existing customers | Renewals and expansion are contributing meaningfully |
| Less than 20% from existing customers | The model may still be highly transactional |
These are diagnostic ranges, not universal benchmarks. Your business model, contract length, and buying cycle matter.
One SaaS example from the source had a single customer responsible for more than 60% of monthly revenue. The business looked healthy until that account left.
The lesson was not simply “get more customers.”
It was:
Watch customer concentration, retention, and repeatability together.
The Customer Who Left
One founder won several early customers and started generating revenue. Because the first sales looked promising, the founder stopped improving the go-to-market process.
Months later, customers left and new sales slowed. The team could not explain why the first customers had bought.
That is the difference between revenue and a repeatable sales system.
A repeatable system gives you a path such as:
X leads → Y meetings → Z customers
You do not need perfect numbers. You need to know what creates the result.

The Metrics That Show Business Durability
Revenue tells you how much money came in.
Durability asks what happens next.
| Metric | What to Watch |
| Net Revenue Retention (NRR) | Do existing customers stay and expand? |
| Repeat Usage | Do customers keep using the core product? |
| Gross Margin | Does serving each new customer become more efficient? |
| Customer Concentration | Would losing one account create serious risk? |
For recurring businesses, NRR above 100% means the existing customer base generates more recurring revenue after churn, renewals, and expansion. Retention is also a key indicator of ongoing customer value. a16z discusses retention as a useful measure for understanding product-market fit and long-term customer behavior. (a16z.com)
The exact benchmark depends on the business model, so use these figures as diagnostic guides, not universal rules.
A Simple Durability Check
Take your last 10 customers and answer five questions:
- Did they come from the same customer acquisition channel?
- Did they have the same core problem?
- Did they follow a similar buying process?
- Did they stay, renew, or expand?
- Could your team repeat the sale without relying on the founder’s personal network?
If most answers are yes, you are seeing a stronger revenue pattern.
If every answer is different, do not hide the inconsistency behind the total revenue number.
Find the common customer, problem, channel, and buying trigger.
A Tinova Proof Point
Tinova’s Results Library documents 200 startups diagnosed and 77+ businesses scaled. Its editorial approach is based on identifying repeated problems across live GAP Analysis calls and measuring which numbers actually help founders make decisions. (tinovagency.com)
One useful Tinova rule is simple:
A number matters when it changes the decision you make next.
A $10K revenue month may look impressive. But if the team cannot explain where that revenue came from, whether customers will stay, or whether the result can happen again, the number tells only part of the story.
What Investors Want to Know About Early Revenue
Investors do not look at revenue in isolation.
They may ask:
Where did the customers come from?
Why did they buy?
How many stayed?
How much does it cost to acquire another customer?
Can the same sales process work again?
What happens if your largest customer leaves?
That is why a startup with lower revenue but clear repeatability can present a very different case from one with higher revenue that depends on a few one-off deals.
Tinova’s investor evaluation checklist covers traction, revenue, retention, CAC, LTV, burn rate, and runway as part of the wider investor picture.
Revenue Is Not the Same as Product-Market Fit
Revenue can come from a one-time purchase, referral, discount, founder relationship, or unusually motivated early buyer.
Product-market fit requires stronger customer evidence.
Customers need to keep using the product, continue paying, renew, expand, or recommend it because the problem matters to them.
Tinova explains this distinction in Does Raising Funding Mean You Have Product-Market Fit?, where the core point is simple: investor confidence and customer demand are two different forms of proof.
Revenue Is the Starting Signal, Not the Answer
Early revenue is worth celebrating.
But do not stop at the revenue number.
Test repeatability.
Measure retention.
Watch customer concentration.
Compare acquisition costs with expansion from existing customers.
Track whether margins improve as the business grows.
The goal is not just to make more sales. It is to build a business that can repeat the way it creates those sales.
FAQs
Is revenue the same as product-market fit?
No. Revenue proves that customers paid. Product-market fit requires stronger evidence that customers keep using, paying for, renewing, expanding, or recommending the product.
How do you know if revenue is repeatable?
Review your last 10 customers. Compare where they came from, why they bought, and whether they followed a similar sales process. A clear pattern is an early repeatability signal.
Why does retention matter more than early revenue?
Retention shows whether customers continue to receive value. Without retention, the business must keep replacing lost customers.
What is customer acquisition cost?
CAC is the cost of acquiring a new customer. It can include marketing, sales, software, commissions, and discounts connected to the first sale.
What is Net Revenue Retention?
NRR measures how recurring revenue from existing customers changes after churn, renewals, upgrades, downgrades, and expansion. Above 100% means the existing customer base is generating more recurring revenue than at the starting point.
What is the difference between new customer CAC and returning customer costs?
New customer CAC covers the work needed to win a first purchase. Returning customer costs relate to keeping or expanding an existing relationship, such as renewals and upsells.
Which metrics show business durability?
Track NRR, repeat usage, gross margin, customer concentration, retention, and acquisition cost. No single metric gives the full picture.
Why can a startup have strong revenue and still be risky?
Revenue can depend on a few large customers, expensive acquisition, one-time deals, or founder-led relationships. The risk becomes clearer when you examine repeatability, retention, and customer concentration.
Further Reading
- Does Raising Funding Mean You Have Product-Market Fit?
- 1,000 Signups Is Not Traction: Why Your First Users Give You Fake Confidence
Need help finding the gaps behind your revenue?
Tinova’s Investor-Ready in 21 Days program helps pre-seed and seed founders strengthen positioning, offer, website, pipeline, and investor-facing assets before a raise.